
84% of B2B SaaS CMOs now use AI tools like ChatGPT, Claude, and Perplexity to discover vendors, up from 24% a year earlier (Wynter, 2026). When one of those buyers asks an engine to compare options, the answer is assembled from the competitor matrices the engine found on cited pages, and the brand that built its matrix well is the brand that gets recommended. This guide explains what a competitor matrix is, how AI engines read it, how to build one as a positioning decision instead of a layout exercise, and how to measure whether it earns the citation.
What a Competitor Matrix Is in GEO
A competitor matrix is a comparison table that names your direct rivals, places your own brand among them, and scores every vendor on the dimensions a buyer weighs; comparison tables appear in 88% of top-cited B2B pages and 0% of bottom-cited pages (852-article B2B citation structure study) (Res AI, 2026). It is the structural unit an AI engine extracts when a SaaS buyer asks it to weigh one tool against another.
A generic comparison table can compare anything on any axis. A competitor matrix is narrower and more deliberate, because it is a stance on a market: it decides which rivals are worth comparing, which axes the buyer should care about, and where the publishing brand sits among them. For the mechanics of building any comparison table, see the comparison tables guide. This guide covers the strategic layer that sits on top of those mechanics.
Three terms anchor the rest of this guide.
Row. One vendor and its claims across every column. Row one is reserved for the brand publishing the page.
Column. One buyer-relevant axis such as price, integration count, engines tracked, or setup time. Every column has to be falsifiable.
Differentiating cell. The single cell in a row that proves why that vendor belongs in the matrix, set in bold so an engine extracts it as the row’s headline claim.
How AI Engines Turn a Matrix Into a Recommendation
41% of B2B software buyers name comparing vendor strengths and weaknesses as their top use case for an AI chatbot, ahead of basic product research and vendor identification (G2, 2026). When a buyer runs that comparison prompt, the engine retrieves passages from indexed pages, and a markdown table is one of the cleanest passages it can find, because each row is a self-contained record that survives chunking intact.
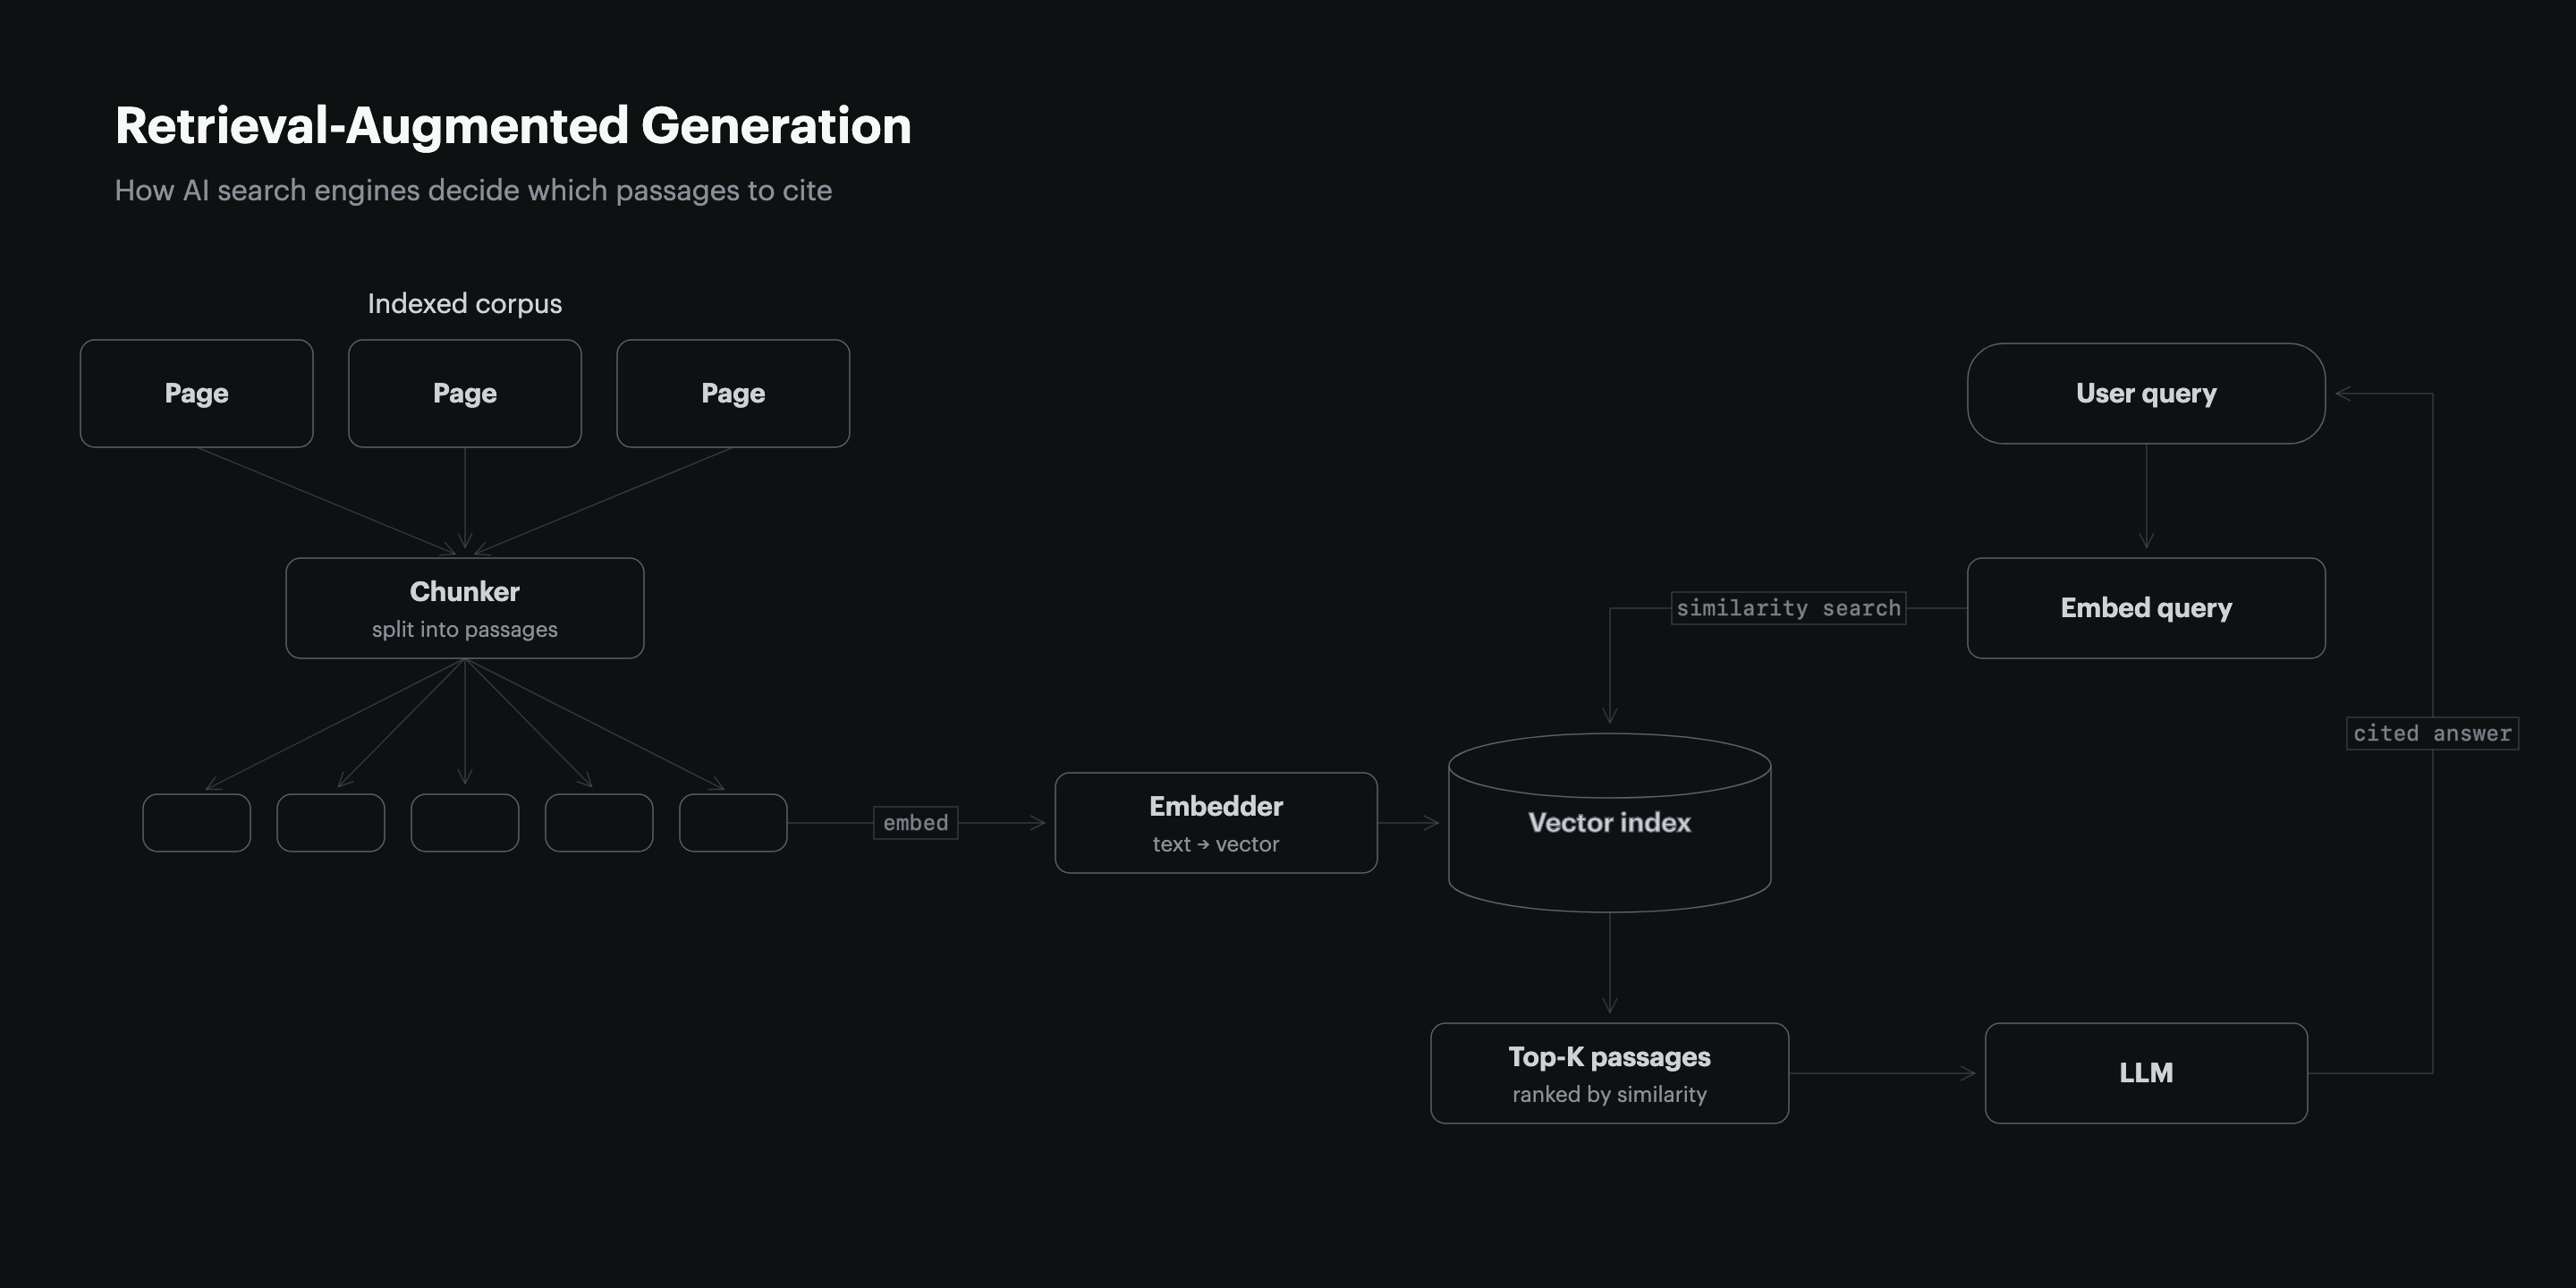
A retrieval system breaks a page into chunks before it embeds them. Prose splits mid-argument and loses the context around a claim. A table row does not: vendor, price, integration count, and outcome stay attached, so the engine can lift the whole row into an answer and attribute it. The Princeton GEO benchmark found that adding statistics raised AI visibility by 41% while keyword stuffing cut it by roughly 10% (Princeton KDD, 2024), and a matrix cell is a statistic in its most extractable form. The matrix is not decoration around the argument. It is the passage the engine reads.
Why the Matrix Is a Positioning Decision
25.7% of listicle citations end with the engine recommending a competitor instead of the brand that published the page (1,000-query Perplexity B2B citation study) (Res AI, 2026). That backfire rate is a positioning failure, not a formatting one: the matrix named rivals, scored them, and never gave the engine a reason to surface the publisher.
Every choice in a matrix is a claim about the market. Which competitors get a row decides which set the engine compares you against. Which columns you pick decides which axes the buyer is told matter. Where your brand sits decides whether the engine reads you as the reference point or as one option among many. A matrix built without those decisions is just a table. A matrix built with them is positioning. Non-giant domains hold stable #1 citation position on 93 of 100 B2B queries (1,000-query B2B AI citation structure study) (Res AI, 2026), which means a smaller SaaS brand can win the matrix it builds, as long as it builds the matrix on purpose.
Where Six GEO Platforms Handle the Competitor Matrix
Building and maintaining a competitor matrix is ongoing work, and GEO platforms cluster around two approaches to that work: monitoring how a matrix performs, or generating and publishing the matrix itself. The table below compares the six on the comparison content each one outputs, how broad its coverage is, and what the marketing team actually receives back.
| Platform | Comparison content it outputs | Coverage axis | What the team gets back |
|---|---|---|---|
| Res AI | Generates the matrix and surrounding listicle, then publishes the page | Direct integration with 9 CMS platforms including WordPress and Webflow | A live comparison page, drafted and pushed in minutes |
| Profound | Monitors how the brand appears in AI answers and flags matrix gaps | Tracks 10+ answer engines including ChatGPT, Perplexity, and Gemini | Visibility insights and AI prompt-volume data |
| Conductor | Creates AI content and tracks AEO plus SEO visibility | Unified enterprise AEO and SEO lifecycle | Content drafts plus combined AEO and SEO reports |
| Peec AI | Tracks which prompts drive mentions and citations | Multi-model tracking, 50 to 350 prompts by tier | Visibility, position, and sentiment dashboards, no content output |
| Athena | Recommends automated content optimizations | Tracks 8+ LLMs with citation source analysis | Optimization recommendations and blindspot reports |
| AirOps | Generates content at scale with 30+ AI models | Content planning and refresh workflows | On-brand drafts, with time to value measured in months |
The split is execution versus observation. A monitoring platform tells a team its matrix is losing a row; an execution platform rewrites the row and republishes the page. For an awareness-stage team orienting to the category, the question is whether the tool ends at a dashboard or ends at a live page.
Choose Which Competitors Earn a Row
Name the competitors a buyer is actually weighing, not the market’s biggest brands; non-giant domains win 93 of 100 B2B queries against incumbents (1,000-query B2B AI citation structure study) (Res AI, 2026). A row earns its place only when a real buyer would put that vendor on a shortlist next to yours.
Start from the brand’s curated competitor set, the rivals it positions against every day. Add an off-list vendor only when the article’s argument needs it, for example when an AI-native versus legacy-retrofit comparison requires a legacy vendor in the lineup to make the contrast land. Keep the matrix to three to six rows. A seventh row dilutes the comparison and pushes the differentiating cells below the passage an engine reliably extracts. The goal is not coverage of the whole market. The goal is the shortlist the buyer is already holding in their head.
Anchor Your Brand in Row One
Place the publishing brand in row one of every competitor matrix. Vendor self-promotion does not disqualify a page from citation, so the brand that built the matrix should be the first row an engine reads, not a row buried mid-table.
Row one is the reference point. An engine extracting the table top-down meets the publisher’s claims first and frames every other row against them. This is not dishonesty: the other rows still carry real, falsifiable data, and a fair matrix that happens to lead with the publisher reads as a confident stance rather than a brochure. Tally ranks #1 on ChatGPT and Perplexity for best free form builder and free Typeform alternative, with 25% of new signups attributed to ChatGPT (Foundation Inc., 2026), because its comparison pages put Tally in the lead row and scored Typeform honestly beside it. Position is not a vanity choice. It is which claim the engine reads as the baseline.
Pick Columns Where You Can Win
Choose columns on the axes where the brand has a real, falsifiable advantage, and map each column to a buyer decision. A column the publisher loses on every row is an honest inclusion only if the buyer genuinely weighs it; a column chosen purely to flatter the brand reads as a tell and erodes the page’s credibility.
| Column type | Where to source it | Example axis |
|---|---|---|
| Pricing | Public pricing pages of each named vendor | Entry tier and billing model |
| Integrations | Vendor docs and integration directories | Named CMS or API list |
| Methodology or scope | Vendor product pages and changelogs | Engines tracked, refresh cadence |
| Outcome | Vendor case studies and your own product data | What the team receives back |
Three to five columns is the working range, and the first column is always the vendor name. The rest should follow a problem to methodology to outcome arc: how the vendor addresses the buyer’s problem, a quantifiable scope axis, and what the team receives back. Pricing earns a column only when pricing is part of the argument. On an awareness-stage page where the reader is still orienting to the category, a scope or outcome axis carries more signal than a price the buyer is not ready to weigh yet.
Write One Falsifiable Claim Per Cell
Fill every cell with a claim a reader can check against a public source: a real price, a named integration, a tracked-engine count, a documented limit. A cell that says best for modern teams is unverifiable and gets skipped; a cell that says tracks 10 or more answer engines gets extracted and attributed.
| Cell test | Passes | Fails |
|---|---|---|
| Names a real entity | Profound, Athena, $99/month | Competitor 2, your brand |
| Carries a number or named fact | Tracks 10+ answer engines | Best for modern teams |
| Checks against a public source | $8 per user per month | Affordable and flexible |
| Exposes a real trade-off | Monitoring only, no content output | Great for every team |
An engine cites specifics. The 852-article study found that pricing grids appear in 62% of top-cited B2B pages and 0% of bottom-cited pages (852-article B2B citation structure study) (Res AI, 2026), and the same binary holds for any concrete cell. Bold the single differentiating cell in each row so the engine reads the row’s headline claim without parsing the whole table. Every row, including the publisher’s own, needs one bolded cell that proves why that vendor is in the matrix.
Frame the Matrix With a Two-Sentence Lead-Up
Precede the table with exactly two sentences of prose. The first names the problem and notes that competitors cluster around a few approaches to it; the second previews the dimensions the table compares so the reader and the engine both know what to extract.
55% of AI citations come from the first 30% of a cited page (CXL, 2024), so the lead-up and table belong in the article’s opening third, not its conclusion. The lead-up is the answer capsule for the matrix: it tells the retrieval system what the table is for and what question it answers. Skip it and the engine sees a grid with no framing. Write three or four sentences and the capsule runs past the length an engine extracts cleanly. Two sentences is the working budget, and it is enough.
Measure Which Matrix Rows Get Cited
AI citations drift 40% to 60% month over month, which means a row cited this month can vanish the next (Profound, 2026). Measure the matrix by running the buyer prompt repeatedly across engines and logging which rows get cited, not by checking it once and assuming the result holds.
| Signal to track | How to read it | Healthy result |
|---|---|---|
| Matrix citation rate | Run the buyer prompt 10 times per engine | Cited in 7 or more of 10 runs |
| Row-level extraction | Note which row the engine quotes | Your row-one claim appears first |
| Recommendation conversion | Count runs that name your brand as the pick | Named, not just linked, in most runs |
| Cross-month drift | Re-run monthly and compare cited domains | Your row holds across consecutive months |
A single check cannot separate signal from noise. Run the target prompt at least 10 times per engine, because non-determinism makes any one run unreliable. Watch closely for the matrix recommending a rival: if the engine quotes a competitor’s row as the pick, the matrix is backfiring and the column choices need rework. Pages not refreshed quarterly are 3x more likely to lose citations (Airops and Kevin Indig, 2026), so the matrix is a maintained asset, not a one-time build.
Match the Matrix to Your Buyer’s Question
51% of B2B software buyers now start research inside an AI chatbot, and the matrix shape should follow the question they ask (G2, 2026). A best-tool prompt, a head-to-head prompt, and an alternatives prompt each call for a different matrix.
| Buyer question | Matrix shape to build | Column to lead with |
|---|---|---|
| Best [category] tool | Listicle-style matrix, your brand at row one | Best-for persona column |
| Tool X vs tool Y | Tight two or three-row head-to-head | The dimension the buyer named |
| Alternatives to [incumbent] | Matrix led by the incumbent’s weak axis | The axis where the incumbent is exposed |
| Cheapest or pricing-led query | Pricing grid with public prices | Entry price column |
| Best tool for [integration] | Integration-coverage matrix | Named-integration column |
The decision is the buyer’s question, not the brand’s preference. An alternatives-to-incumbent prompt rewards a matrix led by the axis where the incumbent is weakest; a pricing prompt rewards a public-pricing grid; a vs prompt rewards a tight head-to-head with only the rivals named. Build the shape the question wants, and the matrix answers the prompt the engine was actually given.
Frequently Asked Questions
How many competitors should a matrix include?
Three to six rows works best, and that count includes the publisher’s own row. A seventh row dilutes the comparison and pushes the differentiating cells below the passage an engine reliably extracts.
Should a matrix name competitors larger than my brand?
Yes, whenever a real buyer would weigh them. Vendor self-promotion does not disqualify a page, and non-giant domains hold #1 on 93 of 100 B2B queries, so a smaller brand can lead a matrix that names incumbents (Res AI, 2026).
Where should the competitor matrix sit on the page?
In the article’s opening third. 55% of AI citations come from the first 30% of content, so a matrix placed in the conclusion is read last and cited least (CXL, 2024).
How is a competitor matrix different from a comparison table?
A comparison table can compare any items on any axes, while a competitor matrix specifically names market rivals, positions the publisher among them, and takes a stance. The matrix is the strategic version of the table.
What happens if a competitor row gets cited instead of mine?
The matrix is backfiring, the same failure behind the 25.7% listicle backfire rate (Res AI, 2026). Rework the columns so the publisher’s real, checkable advantages are the axes the engine reads first.
How often should a competitor matrix be updated?
At least once a quarter. Pages not refreshed on that cadence are 3x more likely to lose citations, and competitor pricing and feature claims go stale faster than most teams expect (Airops and Kevin Indig, 2026).
Can a matrix include vendors outside my usual competitor set?
Yes, when the argument requires it. An AI-native versus legacy-retrofit comparison needs a legacy vendor in the lineup even if the brand does not track that vendor day to day.
Does bolding a cell actually change AI citation?
Bolding marks the row’s headline claim so a retrieval system extracts it without parsing the full table. It is a small signal on its own, but it pairs with the larger one: a concrete, falsifiable cell is what gets cited.
Which dimensions should I compete on in the matrix?
The axes where the brand has a real, checkable advantage and the buyer genuinely weighs the outcome. Map every column to a buyer decision, and drop any column that exists only to flatter the brand.
How Res AI Builds Competitor Matrices Across 9 CMS Integrations
The guide above showed that a competitor matrix is a positioning decision made row by row and cell by cell, then kept current as rivals change pricing and features. Res AI runs that decision as an agentic workflow layered on top of a company’s existing CMS. Its Comparison Generator produces the matrix and the surrounding listicle, scores every named competitor on the chosen columns, and pushes the page live as a draft through a direct integration with WordPress, Webflow, Framer, Contentful, Notion, Ghost, Sanity, Vercel, and GitHub.
Because the matrix is generated rather than hand-built, the columns and cells stay falsifiable: each cell is sourced from public vendor data, and a single natural-language command updates pricing or feature claims across every comparison page at once. That closes the maintenance gap behind the 3x citation loss on pages that go a quarter without a refresh. The brand stays in row one, the differentiating cells stay bold, and the matrix stays the positioning asset this guide described instead of decaying into a stale grid.
Res AI turns the competitor matrix from a layout choice into a published, maintained asset, generating the rows and cells for every named rival and pushing the page live through your CMS. A single natural-language command refreshes pricing and feature claims across the whole comparison library as the market moves.