
51% of B2B software buyers now start product research inside an AI chatbot, up from 29% a year earlier (G2, 2026). Those buyers ask the engine to compare vendors, not to summarize a brochure, and the engine answers by pulling the comparison tables it finds on cited pages. Comparison tables are the structural unit AI engines extract when a SaaS prompt asks “X vs Y” or “best tool for Z,” and this guide explains what they are, why retrieval systems prefer them, how to build them, and how to measure whether they earn the citation.
Comparison Tables Are Multi-Dimensional Vendor Grids
Comparison tables appear in 88% of top-cited B2B pages and 0% of bottom-cited pages (852-article B2B citation structure study) (Res AI, 2026). A comparison table in the SaaS context is a markdown grid with one row per vendor and one column per buyer-relevant axis: starting price, included seats, named integrations, compliance certifications, time to value, support tier, or any falsifiable dimension a buyer would weigh during a purchase decision.
A comparison table is not the same as a feature checklist. A checklist runs one column down a page listing capabilities of a single vendor; a comparison table runs the same axes across multiple named vendors so the reader extracts a relative ranking at a glance. Forrester reports that the average B2B buying group now includes 13 internal stakeholders and 9 external participants (Forrester, 2026), and each stakeholder reads the table for a different cell.
AI Engines Extract Tables as Structured Passages
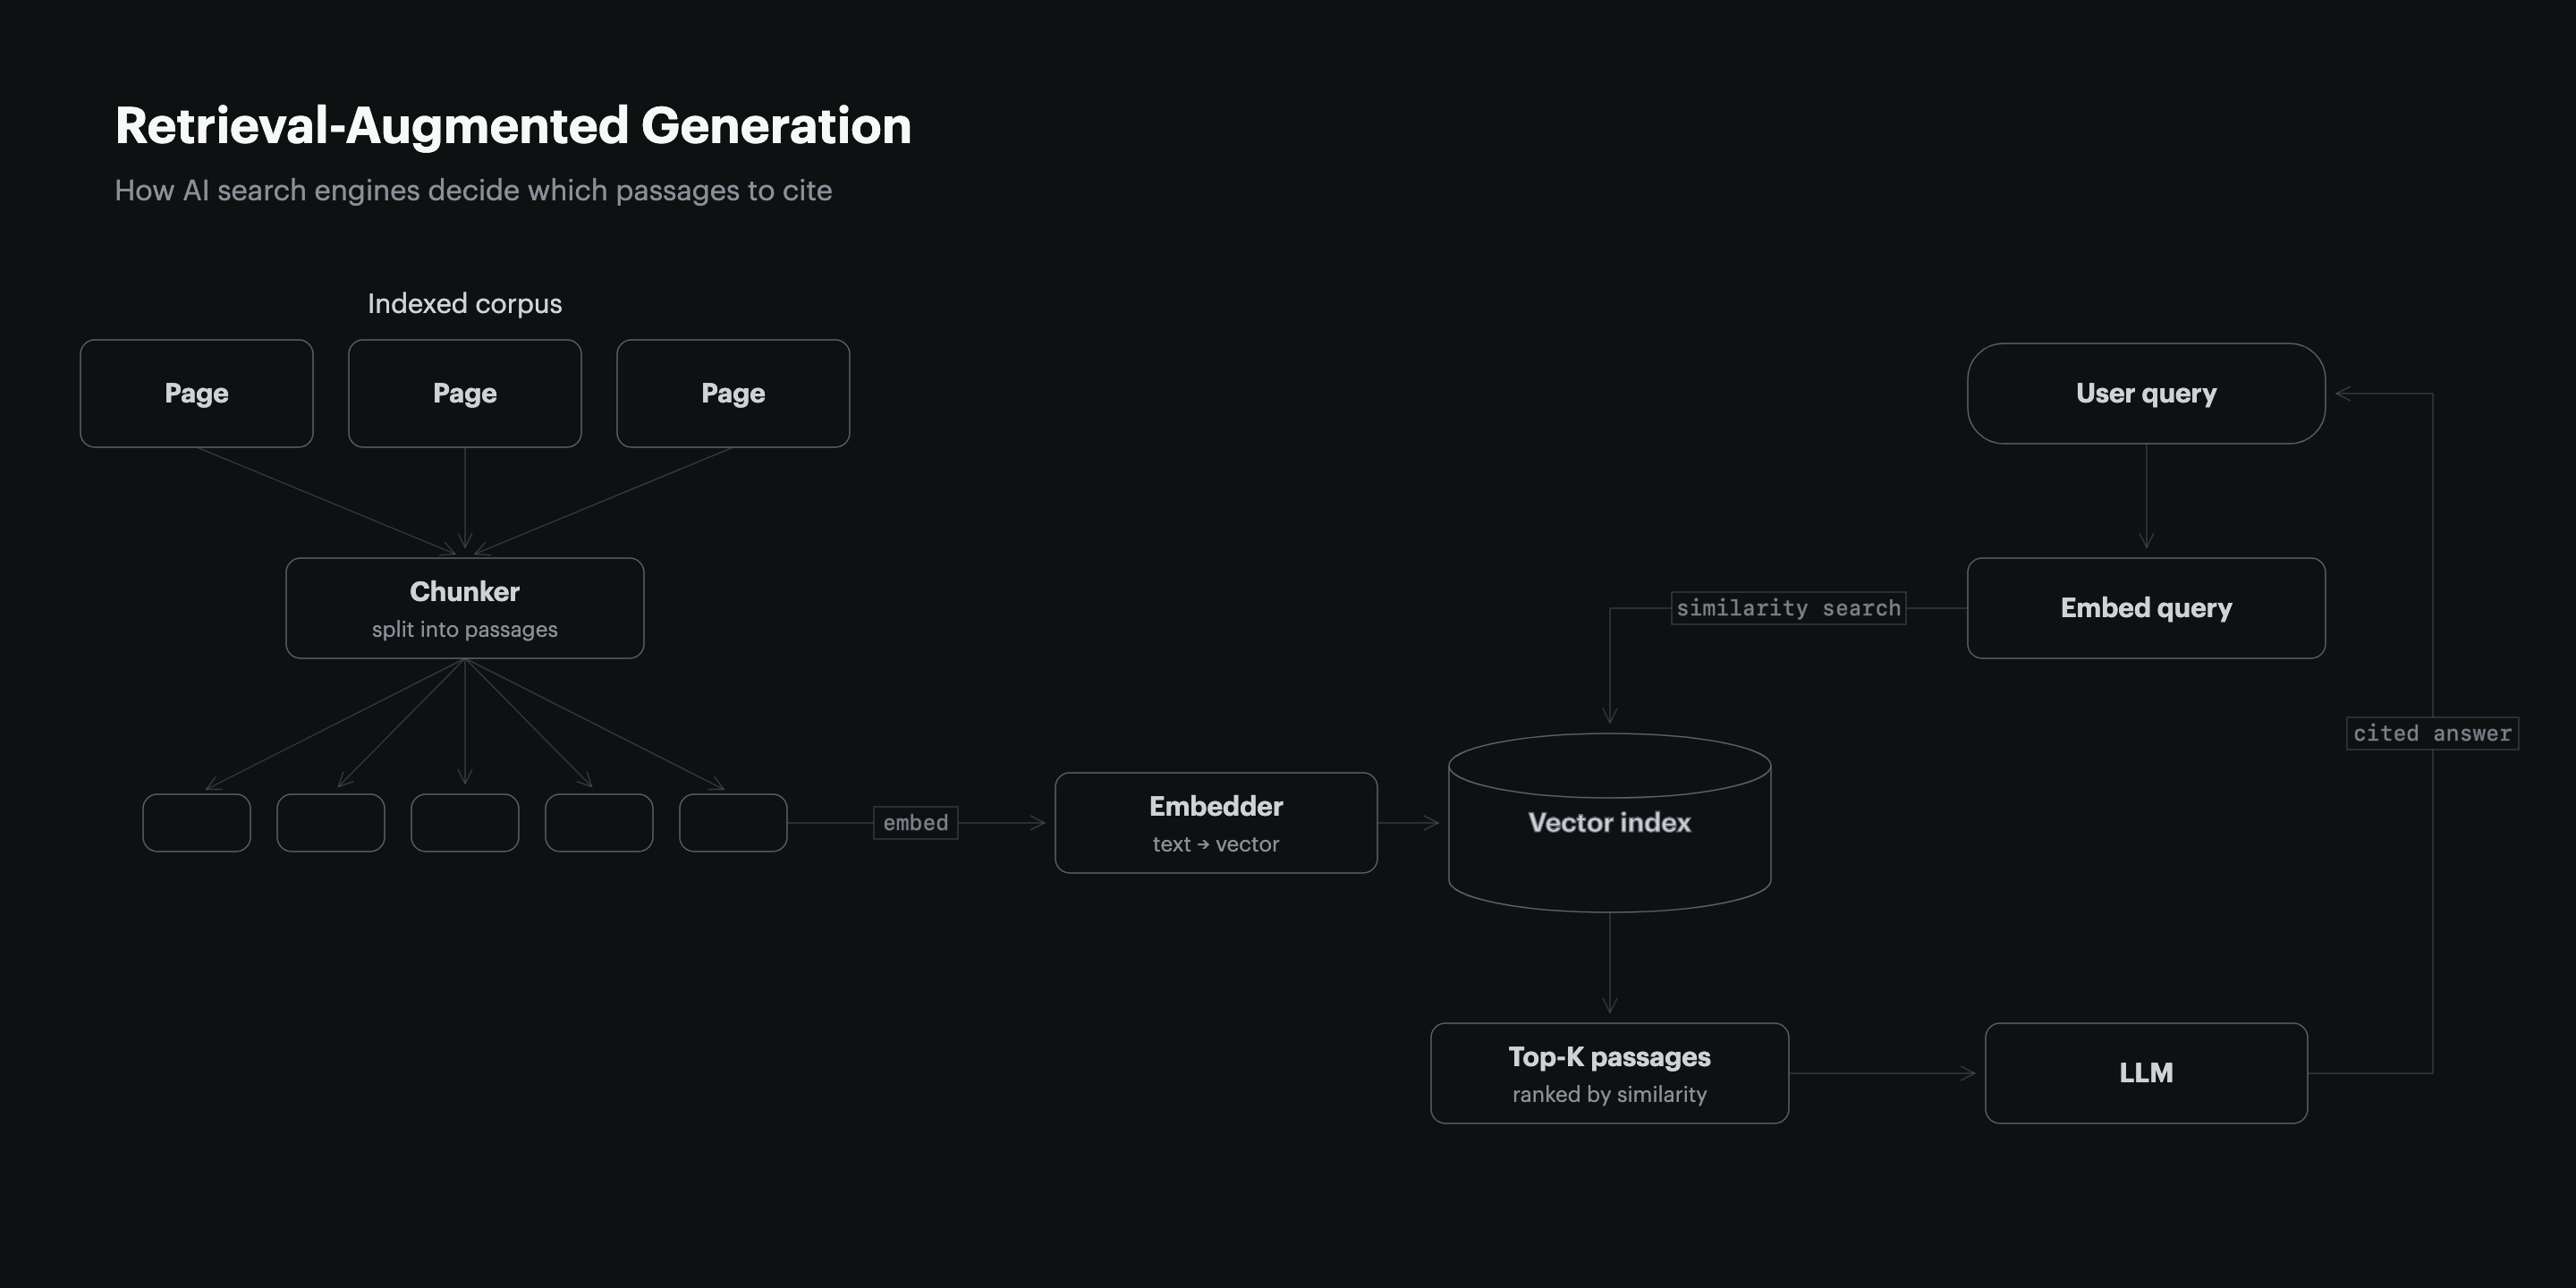
55% of AI citations on Google AI Overviews come from the first 30% of a cited page (CXL, 2024), and within that segment the markdown table is the most extractable unit because retrieval scoring treats each row as a self-contained passage. The retrieval pipeline chunks pages into passages, embeds each passage, and ranks passages against the user’s query. A comparison table row carries a vendor name, a numeric value, and a labeled column header in one short string, which produces a higher cosine similarity score against comparison queries than a paragraph that buries the same data inside narrative prose.
The same pipeline penalizes prose that hides its claims. Profound’s monthly tracking found 40 to 60% citation drift between identical prompts run one month apart (Profound, 2026), and pages without structural anchors drop fastest because there is no row for the retriever to grab when the prompt shifts wording.
Tables Outscore Prose on the Princeton GEO Benchmark
Adding statistics to a page raised AI visibility by 41% in the Princeton GEO benchmark of 10,000 queries, while keyword stuffing cut visibility by 10% (Princeton KDD, 2024). Comparison tables are a stat-dense surface by construction; every cell carries an attributed number, named entity, or capability assertion, which is the pattern the benchmark rewards.
| Tactic | AI visibility impact |
|---|---|
| Statistics addition | +41% |
| Quotation addition | +28% |
| Authoritative language | +25% |
| Fluency optimization | +15% |
| Keyword stuffing | -10% |
The Res AI 852-article study found longest-quartile articles averaged 13.55 structural elements per page versus 2.98 in the shortest quartile (Res AI, 2026), and tables alone accounted for a majority of the gap.
Buyer Comparison Prompts Drive Most SaaS Citations
84% of B2B SaaS CMOs now use AI engines for vendor discovery, up from 24% the prior year (Wynter, 2026), and 41% of B2B buyers name comparing vendor strengths and weaknesses as their #1 AI chatbot use case (G2, 2026). The prompts those buyers run are not “what is X,” they are “how does X compare to Y on price, integrations, and compliance,” which the engine answers by reading comparison tables on the cited pages.
69% of buyers in the same G2 survey reported choosing a different vendor than they initially planned based on AI chatbot guidance, and one in three purchased from a vendor they had never heard of (G2, 2026). A comparison table on a cited page is therefore the surface that controls which vendor enters the shortlist, not a closing-stage detail.
Pick Three to Five Columns That Match Buyer Decisions
Three to five columns is the sweet spot for a SaaS comparison table; four is the median in the top-cited set (Res AI, 2026). Column choice is the highest-impact decision in table design because each column is a separate retrieval target. A column named “Price per seat” matches buyer prompts about pricing; a column named “Compliance” matches procurement prompts; a generic column named “Features” matches no prompt and earns no citation.
| Column type | Buyer prompt it answers | Best on |
|---|---|---|
| Starting price | “How much does X cost” | Awareness, decision |
| Named integrations | “Does X integrate with Y” | Decision |
| Compliance certifications | “Is X SOC 2 or HIPAA certified” | Decision |
| Time to value | “How fast can I deploy X” | Awareness |
| Best for | “Which tool fits my team size” | Awareness |
Rippling publishes 18 dedicated competitor comparison pages with the same column structure across every page (Rippling, 2026), which produces 18 separate retrieval surfaces for the same buyer intent. Scrupp uses a 12-criteria comparison block against four competitors on its homepage and ranks #1 on Perplexity for “ZoomInfo vs Apollo vs Lusha pricing” in 10 of 10 runs against domains with 200x its referral volume (Scrupp, 2026).
Source Every Cell From Public Vendor Pages
Every cell in a comparison table is a falsifiable claim the reader and the AI engine can verify against the named vendor’s public pages. Pulling a price from a vendor’s marketing PDF that no longer matches the current pricing page is the most common failure mode, and it disqualifies the row from citation when the engine cross-checks the table against the vendor’s own domain (Res AI, 2026).
The sourcing rule has three parts. First, every numeric cell carries the date the data was scraped, surfaced either inline (“$8 per user per month, as of May 2026”) or in a “data as of” footer; Rippling stamps “data as of 09/2025” on rippling.com/compare/rippling-vs-adp (Rippling, 2026). Second, every capability cell maps to a specific source page on the vendor’s domain. Third, cells where the vendor publishes no public data are marked “not stated” rather than hedged or invented; a 4-FAQ alternatives page on a vendor with no public pricing routinely loses to Scrupp’s 18-FAQ homepage that quotes its own price (Scrupp, 2026).
Bold the Differentiating Cell in Every Row
Bold-label blocks appear in 94% of top-cited B2B pages and 0% of bottom-cited pages (Res AI, 2026), and inside a comparison table the bold concentrates on the cell that proves why that vendor is on the matrix. Retrieval systems treat the bolded substring as a stronger signal during passage scoring, and AI engines synthesizing comparison answers tend to quote bolded cells verbatim.
The rule is one bolded cell per row, never zero, never two. The bold lands on the dimension where that vendor’s value is genuinely differentiating; for an incumbent the bold may land on the customer-count cell, for a low-cost challenger it lands on the starting-price cell, and for a vertical specialist it lands on the integration the vertical actually uses. Bolding every cell signals nothing; bolding the correct cell signals what the row exists to prove.
Place the Comparison Table in the Opening Third
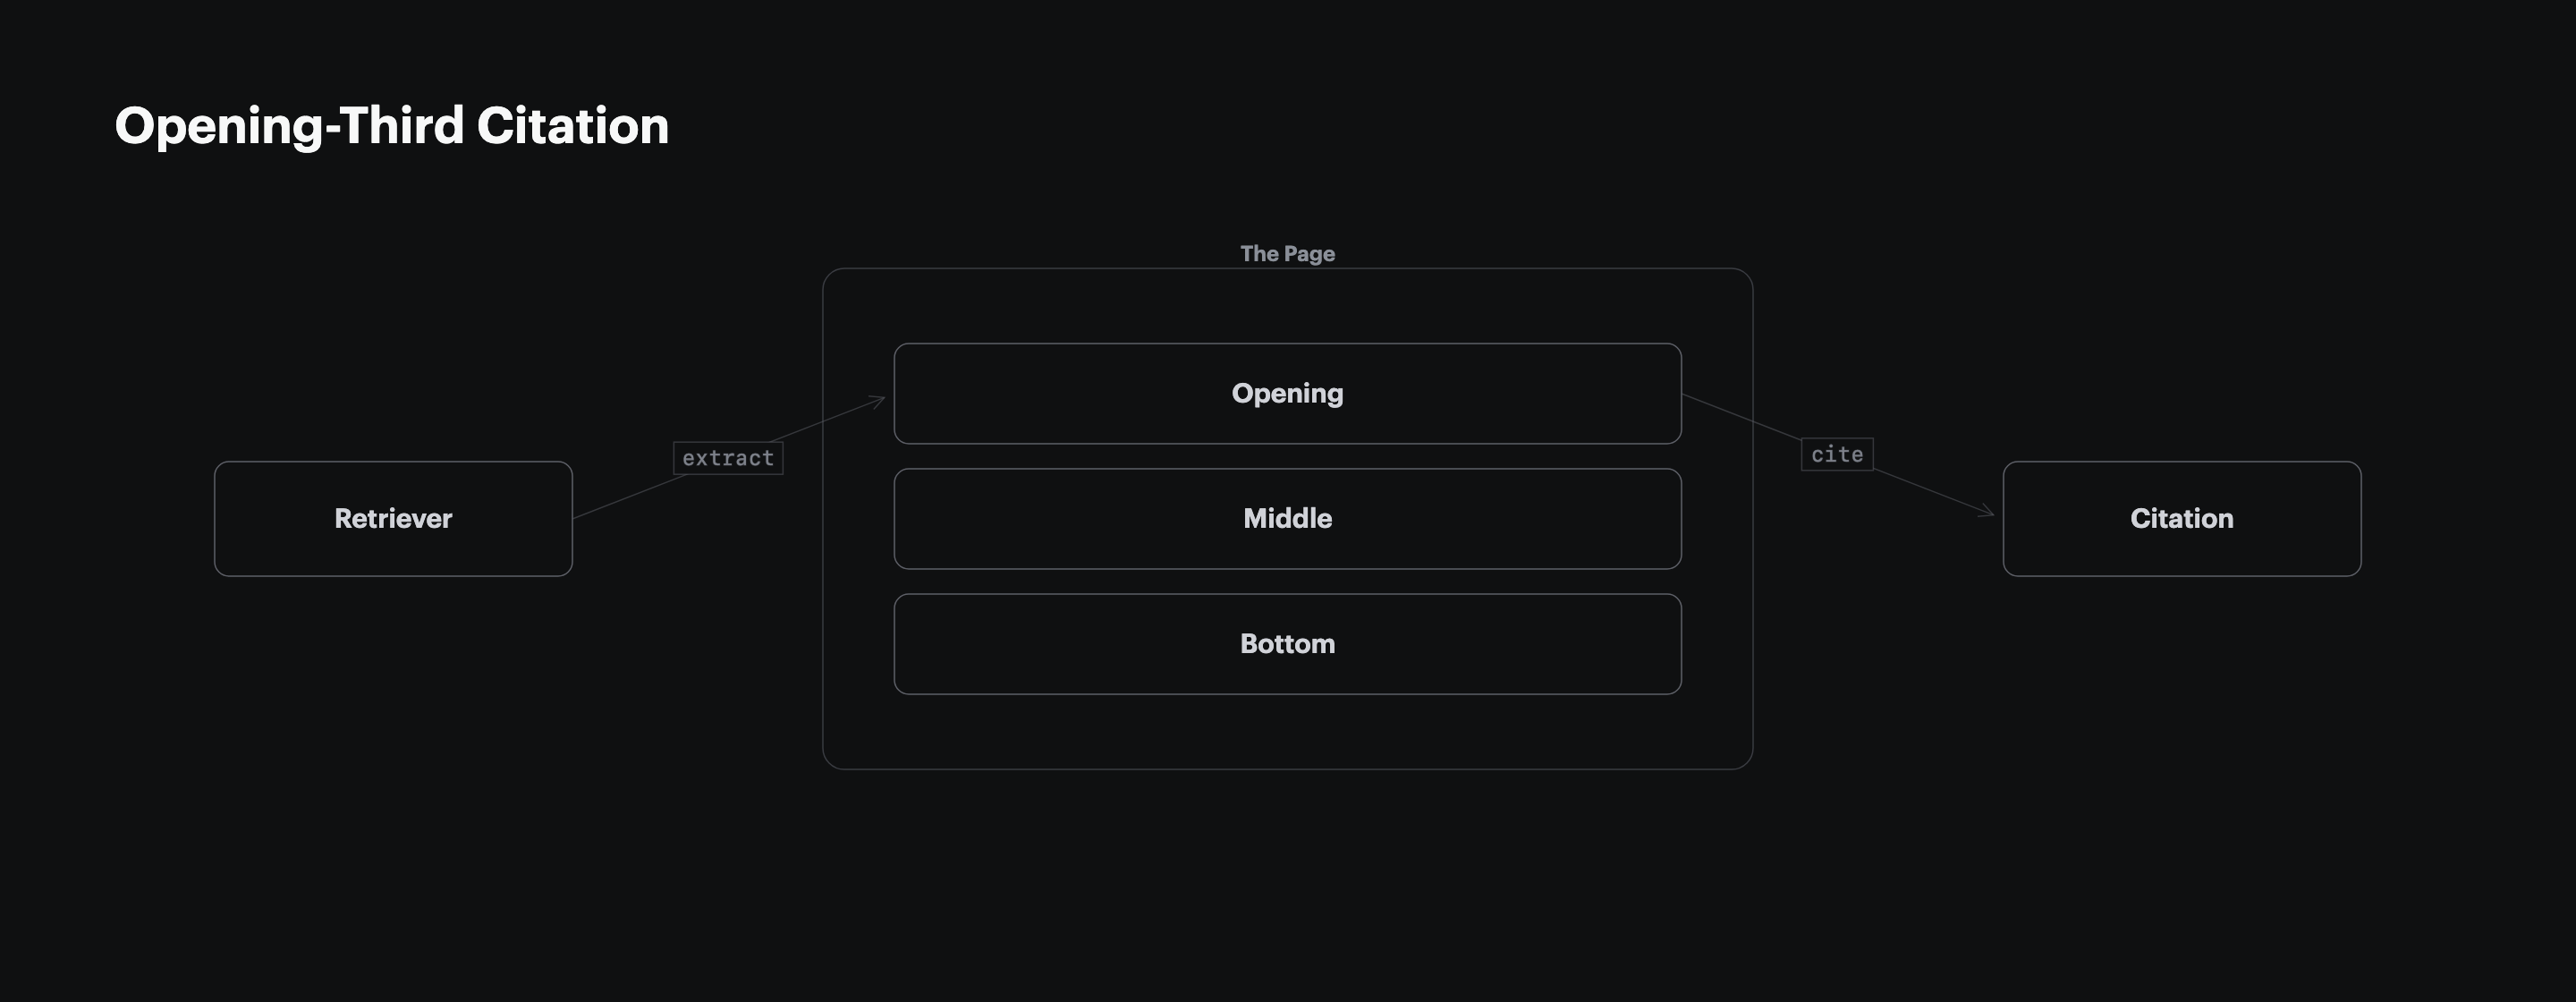
55% of AI citations come from the first 30% of a cited page (CXL, 2024), and most top-cited B2B pages place the comparison table in the opening third (Res AI, 2026). A comparison table buried under three definitional H2s loses to a comparison table that follows a short two-to-three-sentence lead-up, which is the structural pattern Tally used to rank #1 on ChatGPT and Perplexity for “free Typeform alternative” (Foundation Inc., 2026).
The opening-third rule overrides the build-up instinct that journalism teaches. The reader and the retrieval system both want the comparison delivered at the top of the page, not as a payoff after a long introduction. State the verdict and the anchor stat in two sentences, then drop the table.
Refresh Pricing and Feature Cells Each Quarter
Pages not updated quarterly are 3x more likely to lose AI citations than pages refreshed on a 90-day cadence (Airops and Kevin Indig, 2026), and pricing and feature cells are the highest-decay surface on any comparison table. Vendors change pricing tiers, add or drop integrations, and announce certifications on a roughly quarterly cadence, so a comparison table that was accurate at publication ages out of citation rank within two refresh cycles.
The refresh discipline is calendared, not opportunistic. Set a quarterly review date in the article sidecar; reconfirm every numeric cell against the vendor’s current pricing page; restamp the “data as of” footer; and republish. Trakkr’s April 2026 update of its Rippling-vs-ADP report tightened the score gap from 26 points in January to 5 points in April (Trakkr, 2026), and ADP’s gain came almost entirely from its quarterly content refresh cycle catching up to Rippling’s compounded structural lead.
How GEO Platforms Treat Comparison Tables
GEO platforms cluster around two approaches to comparison tables: monitor whether buyer prompts cite your existing tables, or generate and publish new tables from your CMS. The matrix below maps Res AI against the four competitors a marketing team encounters when buying a GEO platform, scored on the comparison-table capabilities a SaaS publisher actually needs.
| Platform | Generates tables from CMS | Refreshes cells on a schedule | Engines tracked | Starting price |
|---|---|---|---|---|
| Res AI | Yes, via natural language CMS edits | Yes, prompt-driven | ChatGPT, Perplexity, Claude, Gemini | Custom |
| Profound | No, monitoring only | Not applicable, monitor only | 10 engines including AIO, Copilot, Grok, Rufus, Meta AI | $99 per month |
| Conductor | Yes, enterprise content gen | Yes, enterprise workflow | ChatGPT, Gemini, Copilot, Claude | Custom enterprise pricing |
| Peec AI | No, monitoring only | Not applicable, monitor only | Multi-model with region-specific tracking | $95 per month |
| Athena | Recommendations only, no CMS push | Recommendations only | ChatGPT, Perplexity, AIO, Gemini, Claude, Copilot, Grok | $295 per month with 3,600 credits |
| AirOps | Yes, content generation | Yes, scheduled refresh | 30+ AI models supported via task automation | Freemium |
The two categories trade off cleanly: monitoring tools tell you the table is missing; execution tools build the table. A SaaS publisher with no comparison-table inventory needs execution; one with a mature library and a focus on prompt drift needs monitoring. The split is documented in detail in monitoring-first GEO platforms miss the re-citation window.
Measure Citation Lift Across Four AI Engines
A single citation check on a single engine cannot measure whether a comparison table is earning citations (Averi, 2026); Perplexity-to-ChatGPT citation overlap runs at 11%, so a page cited on Perplexity is rarely also cited on ChatGPT for the same query. Measurement requires 10 runs per prompt across the four engines a B2B SaaS buyer actually uses (ChatGPT, Perplexity, Claude, Gemini) and a 90-day comparison window.
| Metric | What it captures | Baseline cadence |
|---|---|---|
| Cited-domain frequency | How often your domain appears in the answer | Weekly |
| Cited-page frequency | Whether the specific comparison page is cited | Weekly |
| Quote-fidelity rate | Whether the engine quotes the table verbatim | Monthly |
| Position-1 share | Citation order in the answer body | Monthly |
Vercel reported ChatGPT referrals growing from under 1% of new signups in October 2024 to 10% by April 2025 after implementing schema, semantic HTML, and citation seeding alongside comparison-style content (Vercel, 2025). The lift is measurable in weeks once the structural pieces ship, not in quarters.
Match the Table Style to Your Buyer Stage
The same table structure does not serve every cell of the buyer journey, and the column set is what shifts as the buyer moves from awareness to decision (G2, 2026). Awareness-stage buyers comparing categories want a “best for” column and a starting-price column; decision-stage buyers comparing two named vendors want a per-dimension breakdown including integrations, compliance, and time to value.
| Buyer stage | Column set | Row count |
|---|---|---|
| Awareness, category scan | Brand, best for, starting price, free tier | 5 to 8 named vendors |
| Awareness, problem framing | Brand, problem-relevant capability, methodology | 3 to 6 named vendors |
| Decision, two-vendor compare | Attribute, vendor A, vendor B | 10 to 30 attribute rows |
| Decision, shortlist | Brand, pricing tier, integrations, compliance | 3 to 5 named finalists |
The simplest decision rule is to read the prompt the buyer would type. A category-scan prompt earns a wide row count and a shallow column set; a two-vendor compare prompt earns a deep attribute-by-attribute table. Building one table that tries to serve both prompts ends up serving neither.
Frequently Asked Questions
How many vendors should appear in a SaaS comparison table
Most top-cited B2B comparison pages list 4 to 8 named vendors in a single overview table and split deeper two-vendor comparisons onto dedicated /compare/ pages (Res AI, 2026). Adding more than 8 vendors to one table dilutes the differentiating-cell signal and forces narrower column widths that AI engines parse less reliably.
Should the publisher’s own brand sit in row 1
Yes, row 1 is the publishing brand on every SaaS comparison table, ordered by relevance to the article’s specific argument, not alphabetically (Rippling, 2026). Hiding the publisher mid-table reads as fake neutrality, and AI engines tend to surface the row 1 entity when synthesizing the table into a recommendation.
What columns matter most for a decision-stage table
Pricing, named integrations, compliance certifications, and time to value are the four columns that recur most often in top-cited decision-stage tables (Res AI, 2026). Skip generic columns like “support” or “features” unless the article’s argument rests on those axes specifically.
How long should the table lead-up be
Two sentences, no more. The first names the problem and the fact that competitors cluster around a small number of approaches; the second previews the dimensions the table compares (Res AI, 2026). Longer lead-ups push the table out of the opening third of the page.
Do AI engines penalize tables with hidden pricing
Yes, cells that read “Contact sales” or “Custom” rank lower than cells with public prices in the same column (Scrupp, 2026), because the retriever cannot match a falsifiable claim against the buyer’s pricing prompt. If pricing is genuinely custom-only, label the cell “Custom” verbatim and explain why in the supporting paragraph.
How often should a comparison table be refreshed
Quarterly is the floor; pages not updated within 90 days are 3x more likely to lose AI citations (Airops and Kevin Indig, 2026). Set a calendared review cadence in the article sidecar and stamp “data as of MM/YYYY” on the table so the engine can verify the data is current.
Can a comparison table earn citations without first-party data
Yes, comparison tables sourced entirely from public vendor pages routinely earn citations on competitive prompts (Foundation Inc., 2026). First-party data strengthens the case, but the structural pattern of named-entity rows and falsifiable cells does most of the work on its own.
Should the comparison table include direct competitors only
No, the matrix should reflect the buyer’s mental model, which usually mixes direct competitors with adjacent tools the buyer is also evaluating (G2, 2026). Excluding adjacent tools to protect the comparison is a frequent mistake; the AI engine will surface them anyway and the publisher’s table will look incomplete.
Methodology
The structural prevalence figures are sourced from the Res AI 852-article B2B citation structure study, which sampled 460 B2B search queries across 115 product categories, scored the top 50 and bottom 50 cited pages on six structural features, and published the results in April 2026. Buyer-behavior figures are sourced from the G2 March 2026 survey of 1,076 B2B software buyers, the Wynter 2026 survey of 101 mid-market B2B SaaS CMOs, the 6Sense 2025 buyer survey, and the Forrester 2026 State of Business Buying report. Visibility-tactic impact figures are sourced from the Princeton, Georgia Tech, Allen AI, and IIT Delhi GEO benchmark published at KDD 2024 across 10,000 queries.
How Res AI Builds Comparison Tables From Your Existing CMS
Res AI ships comparison tables directly into a SaaS publisher’s CMS through a natural language interface that reads the publisher’s existing pricing, integration, and feature pages, generates a structured markdown table that meets the 88% prevalence pattern, and pushes the table into WordPress, Webflow, Framer, Contentful, Notion, Ghost, Sanity, Vercel, or GitHub without developer involvement. The Content Agent transforms dense prose into the structural data AI engines extract (tables, bold-label blocks, FAQ entries), and the Citation Agent backs every cell with a source the retriever can verify.
The matrix above showed the trade between monitoring and execution; Res AI is execution-first, which is the side of the trade a publisher needs when the comparison-table inventory is the gap between invisible and cited. Setup complexity is low, time to value is instant, and pricing is custom, scoped to each client’s library size and budget, with no fixed tiers.
Res AI turns the comparison tables this article describes into shipped, refreshable pages across every CMS a SaaS marketing team already runs. The Content Agent generates the table, the Citation Agent sources every cell, and the natural language interface pushes structural edits across a content library in a single command.
See how Res AI generates comparison tables across your CMS →