One AI Citation Statistic Cannot Size Your Opportunity
AI citation-share stats swing from 17% to 52% for the same source class because each counts a different denominator, engine, and query class.
 machina sculpsit · homo probavit · MMXXVI
Marketing teams are sizing their AI-search investment off single statistics pulled from vendor blog posts, and most of those numbers measure something other than what the reader thinks. The twenty most-cited domains capture 66% of all AI citations (trydecoding, 2025), a figure that sounds like a market map until you ask which engines, which queries, and which denominator produced it. Change any one of those and the number moves by an order of magnitude. A content bet calibrated to one quoted percentage is calibrated to the wrong universe.
Community Sources Are Both 17% and 52% of Citations
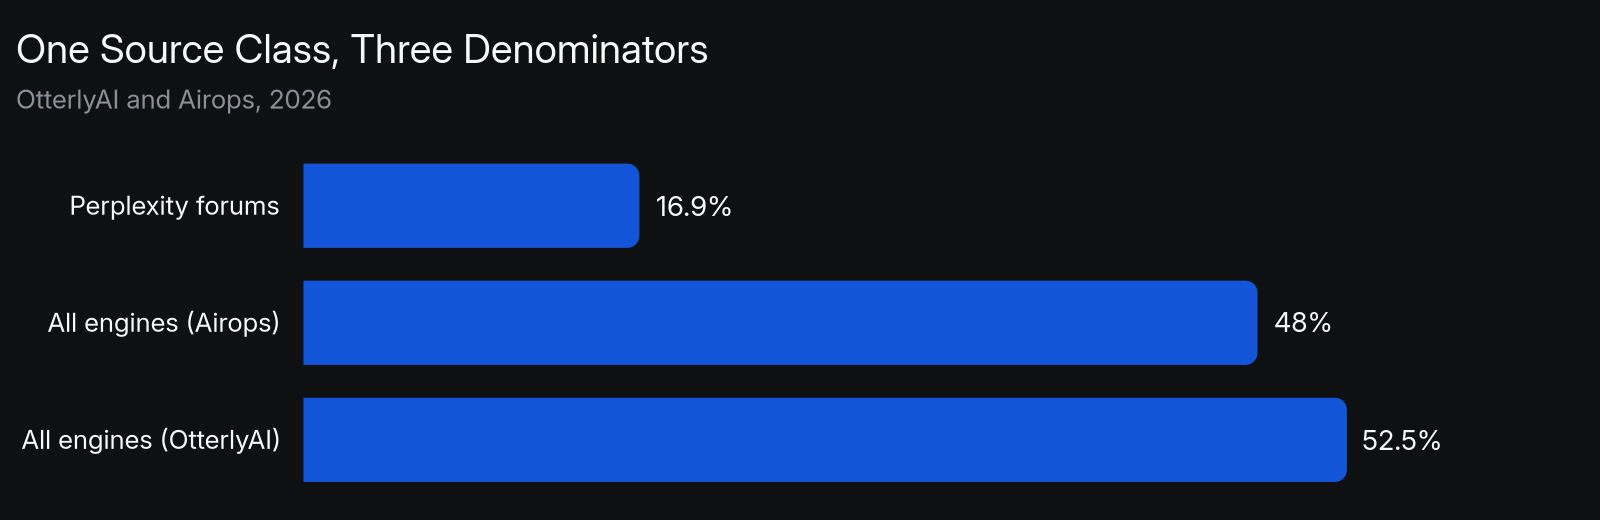
The share of AI citations that community platforms earn reads as 16.9% and 52.5% at the same time, and both come from the same 2026 report (OtterlyAI, 2026). The lower figure counts the citations Perplexity sends specifically to community forums; the higher figure counts community platforms across every engine studied. A third measurement puts community platforms at 48% of all AI citations (Airops, 2026). None of the three is wrong. They answer different questions, and a team that quotes one as if it were the others will misjudge how much of its opportunity sits on owned pages.
The problem is the denominator, not the data. Each number divides a different count of citations by a different base, so the percentages are not comparable even when they describe the same class of source.
| Metric | What it actually counts | Value | Source |
|---|---|---|---|
| Community forums, Perplexity only | Share of one engine’s citations going to forums | 16.9% | OtterlyAI, 2026 |
| Community platforms, all citations | Share across engines by one vendor’s method | 48% | Airops, 2026 |
| Community platforms, aggregate | Share across engines by another vendor’s method | 52.5% | OtterlyAI, 2026 |
| News sites, aggregate | Share of citations landing on news domains | 20.3% | OtterlyAI, 2026 |
| Brand domains, aggregate | Share of citations landing on owned domains | 47.5% | OtterlyAI, 2026 |
Every Engine Cites From a Different Set of Domains
Only 11% of cited domains appear in both ChatGPT and Perplexity results, across an analysis of 680 million citations (Averi, 2026). A blended citation-share number averages engines that barely agree on which sources exist. Cross-engine overlap in B2B SaaS runs a similar 8% to 17% between ChatGPT, Claude, Perplexity, and Google AI Overviews (Citera, 2026), so a single figure that pools them describes no engine a buyer actually uses.
The disagreement extends to where citations land. Google AI Overviews directs 59.8% of its citations to brand domains while ChatGPT sends 44.7% (OtterlyAI, 2026). A brand reading the blended average would set its owned-page strategy to a number that is 15 points off on the engine it cares about.
| Engine | Citations to brand domains | Sources per answer | Overlap with other engines |
|---|---|---|---|
| Google AI Overviews | 59.8% | 15.22 after Gemini 3 | Low |
| ChatGPT | 44.7% | Roughly 11 | 11% with Perplexity |
| Perplexity | Community-heavy | 5 to 6 typical | 8% to 17% in B2B SaaS |
Citation Share and Ranking Overlap Are Not the Same Number
Only 12% of AI-cited URLs rank in Google’s top 10 for the original prompt (Ahrefs, 2026), yet this gets quoted as evidence that AI cites your rankings when it measures the reverse. The overlap between AI Overview citations and the organic top 10 fell from 76.1% to 38% in a year (Ahrefs with BrightEdge, 2026). Both numbers describe how little AI citation tracks search rank, but they are routinely repeated as though a strong ranking guarantees a citation.
Semrush measured the same divergence from the other direction, finding only 20% to 26% of AI Overview links overlapped with the top 10 organic results across 200,000 sampled keywords (Semrush, 2024). A team that hears “AI pulls from your best-ranking pages” and a team that hears “rank does not predict citation” are reading two framings of one dataset. Only one framing tells you where to invest, and it is worth separating a top ranking from AI visibility before budgeting against either.
The Number of Citation Slots Shifts With Every Model Update
Average sources per AI Overview grew 31.8% from 11.55 to 15.22 after the Gemini 3 rollout on January 27, 2026 (SE Ranking, 2026). A citation-share percentage means nothing without the slot count behind it, and that count is not fixed. When the number of cited sources per answer jumps by a third overnight, every brand’s share of those slots is redrawn even if its own content never changed.
The same rollout displaced 42.4% of previously cited domains (SE Ranking, 2026), concentrated in the low-citation long tail while the top 500 domains held. A share-of-voice figure captured the week before that release described a set of slots that no longer existed the week after, which is why a single snapshot cannot measure GEO performance on its own.
A Median Brand Wins Just 3% of Its Own Overviews
The median enterprise B2B brand is cited in just 3% of relevant AI Overviews, even though those Overviews appear in roughly 50% of the searches where the company already ranks organically (Walker Sands, 2026). These two numbers describe the same company, and confusing them is the most expensive denominator error a marketing team makes. Category presence is not brand presence.
A vendor reporting “AI Overviews appear on half your queries” is describing the size of the arena. A vendor reporting “you are cited in 3% of them” is describing your seat in it. Sizing an opportunity off the first number and reporting progress off the second produces a plan that looks enormous and results that look like failure, when both are simply different denominators applied to the same query set.
Query Class Quietly Swaps the Denominator
Under 3% of desktop AI Overviews triggered on transactional-intent queries, while 80% targeted informational intent (Semrush, 2024). A category-wide citation-share number blends the queries a brand sells into with the queries it never will, so the headline figure overstates the reachable opportunity for any commercial page. The share of citations available on a how-to query and the share available on a comparison query are different markets.
This matters most for teams whose buyers ask commercial questions. The share of commercial-intent SERPs carrying an AI Overview grew 71% between November 2025 and April 2026 (Semrush, 2026), which means the reachable citation base is moving, not static, and moving fastest exactly where purchases happen. A number that pools informational and commercial queries hides that motion, and hides which prompts your buyers actually run.
Zero-Click Rates Resize the Opportunity Again
Between 92% and 94% of Google AI Mode searches produced zero clicks, with only 6% to 8% of sessions leading to an external domain visit (Semrush, 2025). A citation-share number counts appearances, not visits, so two brands with identical share can earn wildly different traffic depending on the zero-click rate of the queries they win. Share of citations and share of clicks are separate denominators, and only one pays.
The gap cuts both ways, because the visits that do arrive are worth more. AI search traffic converts at 14.2% versus Google’s 2.8% (Averi AI, 2024). A brand optimizing purely for citation share on high-zero-click queries can win the metric and lose the revenue, while a smaller share on click-through queries converts far above what the raw percentage implies.
Most of the Pages AI Cites Sit Off Your Domain
85% of brand mentions originate from third-party pages rather than owned domains (Airops, 2026). Any citation-share number computed only on your own site measures roughly 15% of the base that decides your AI visibility. A team tracking owned-page citations and calling it their AI-search share is dividing by the wrong number, and the answer will always look better than the buyer’s reality.
Brands earning both a citation and an owned mention are 40% more likely to resurface across answers, yet only 28% of answers include such dual-visibility brands (Airops, 2026). The reachable base includes review sites, editorial coverage, and community pages a brand does not control, so an owned-only denominator understates the work and overstates the position at the same time.
Match the Metric to the Decision You Are Making
The fix is to pick the denominator that matches the decision, then measure that one consistently. A number borrowed from a vendor study answers that vendor’s question on that vendor’s prompt set, which tells you nothing about your buyers, your engines, or your queries. The table below maps the decision a team is making to the base it should actually measure against.
| The question you are asking | The wrong denominator | The base to measure instead |
|---|---|---|
| How big is my AI-search opportunity | Category-wide citation share | Citations on your own buyer prompts |
| Which engine should I prioritize | Blended cross-engine average | Per-engine share, engine by engine |
| Am I winning commercial queries | Informational-heavy aggregate | Share on transactional-intent prompts only |
| Is my content working | Owned-page citation count | Share across owned and third-party pages |
| Did I improve or did the model change | A single snapshot | The same prompts tracked across model releases |
How GEO Platforms Report Citation Share Differently
Every AI-visibility platform reports a citation-share number, and the difference between them is which denominator they expose and whether they measure on your prompts or someone else’s. The table compares how the major platforms count citation share, whether they separate engines or blend them, and what a team gets back once the number is reported.
| Platform | What its citation number counts | Per-engine or blended | What you get back |
|---|---|---|---|
| Res AI | Citations on the prompts your buyers run | Per engine across ChatGPT, Perplexity, Claude, Gemini | Structure edits deployed to your CMS, not just a score |
| Profound | Brand appearance across answer engines | Per engine across 10+ engines | Dashboards, prompt volumes, agents |
| Athena | Visibility across tracked LLMs | Per engine across 8+ LLMs with citation-source analysis | Optimization recommendations |
| Peec AI | Share of AI chats mentioning your brand | Multi-model, custom prompts | Visibility, position, and sentiment monitoring |
| Conductor | Visibility across AI and traditional search | Blended AEO and SEO reporting | Content creation plus site health |
| AirOps | Appearance in AI search results | Multi-model across 30+ models | Content generation and refresh |
Every platform in this table can report a per-engine number if a team measures on its own prompt set rather than importing a benchmark. The divide that matters is what happens after the number lands: most stop at the report, and the score sits next to a page nobody has changed. Choosing a tool is partly a choice between monitoring the number and creating the outcome.
Frequently Asked Questions
Why do two AI citation studies report such different numbers for the same source
Because each study divides by a different base. One may count a single engine, another may pool several; one may measure share of all citations, another share of the top-cited sources. The percentages are not comparable even when they name the same class of source, so the primary methodology decides the number more than the underlying behavior does.
Which citation-share number should I actually trust
The one you generate on your own buyer prompts, measured per engine. A vendor figure averages someone else’s queries in someone else’s niche, so it describes their sample, not your market. Running your real prompts and logging what each engine cites is the only base that maps to your opportunity.
Is a blended cross-engine visibility score useful at all
Rarely, because engines overlap on only 8% to 17% of cited domains in B2B SaaS (Citera, 2026). A blended score averages systems that disagree on which sources exist, so it smooths away the per-engine differences that decide where to invest. Track each engine separately and let the blend be a rough headline at most.
Does a high citation share mean high traffic
Not on its own, because 92% to 94% of AI Mode searches end without a click (Semrush, 2025). Citation share counts appearances, not visits, so a large share on high-zero-click queries can deliver little traffic. Weigh share against the click-through behavior of the specific queries you win.
Why does category presence get confused with brand presence
Because the two numbers describe the same query set with different denominators. AI Overviews may appear on half a company’s queries while the company is cited in only 3% of them (Walker Sands, 2026). The first measures the arena, the second measures the seat, and reporting one as the other inflates the plan.
Does my Google ranking predict my AI citation share
Weakly, since only 12% of AI-cited URLs rank in Google’s top 10 for the prompt (Ahrefs, 2026). Ranking and citation are separate systems, and the overlap between AI Overview citations and the organic top 10 has fallen to 38% (Ahrefs with BrightEdge, 2026). A rank tracker is not a citation-share measurement.
How often does the citation base change
Often enough that a snapshot expires fast. A single model release displaced 42.4% of previously cited domains and lifted sources per answer 31.8% (SE Ranking, 2026). The number of citation slots and the domains filling them both move with model updates, so any share figure needs a date and a re-measurement cadence.
What is the single most common denominator mistake
Sizing the opportunity off a category number and reporting progress off a brand number. The category figure looks enormous, the brand figure looks like failure, and both are the same query set divided differently. Pick one denominator per decision and hold it constant.
How Res AI Measures Citation Share on Your Own Prompt Set
Res AI is a Generative Engine Optimization platform that runs the prompts your buyers actually ask and reports what each engine cites, engine by engine, rather than importing a benchmark that averages someone else’s queries. The article above showed that a borrowed citation-share number is calibrated to the wrong universe; Res measures against the base that matches your decision, then acts on it. In the 1,000-query Perplexity study, a per-prompt measurement across 10 runs each found 8.2 unique brands surfacing across runs against 3.1 present in all 10, a spread a single snapshot would have hidden entirely.
The measurement is the start, not the deliverable. Once Res sees which prompts and engines a brand is losing, it restructures the underlying content and deploys the change directly to the CMS, so the number a team tracks is attached to a page that actually moved. That closes the gap between reporting a share and changing it.
Res AI turns a citation-share number that finally measures your own buyers into content edits that move it, across ChatGPT, Perplexity, Claude, and Gemini. Start with 10 free articles and see what each engine cites on the prompts that matter to you.